[Visto: 440 veces]
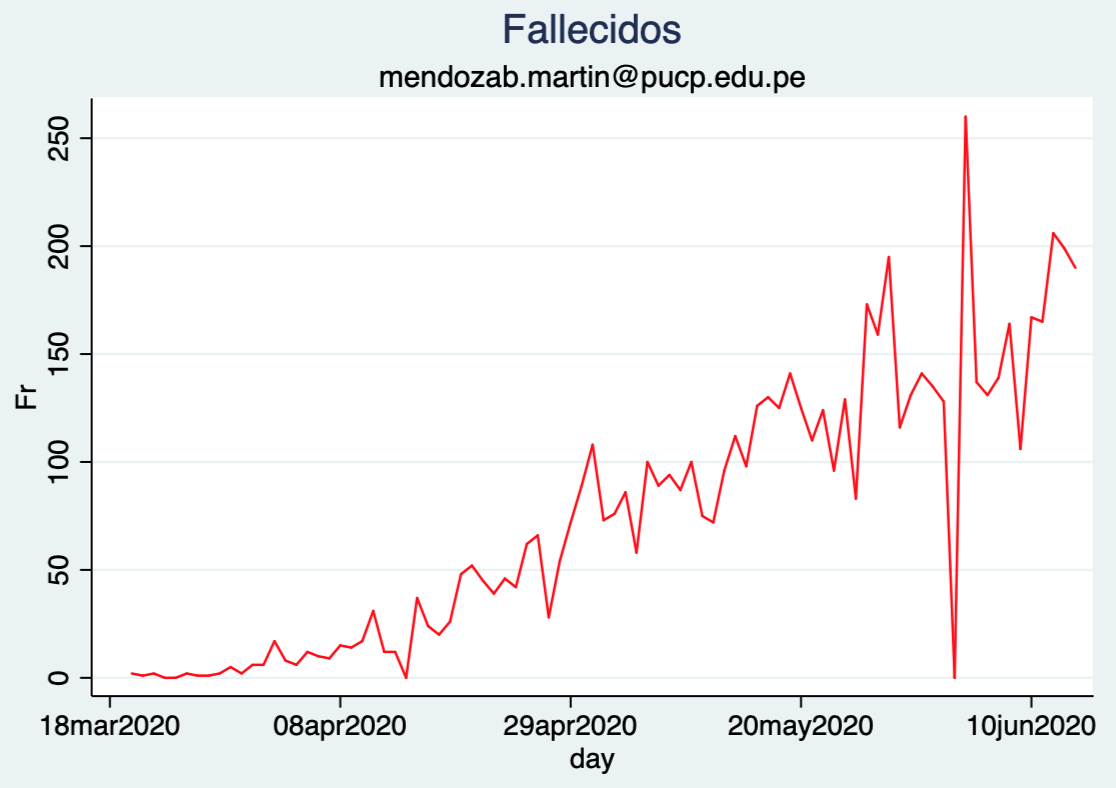
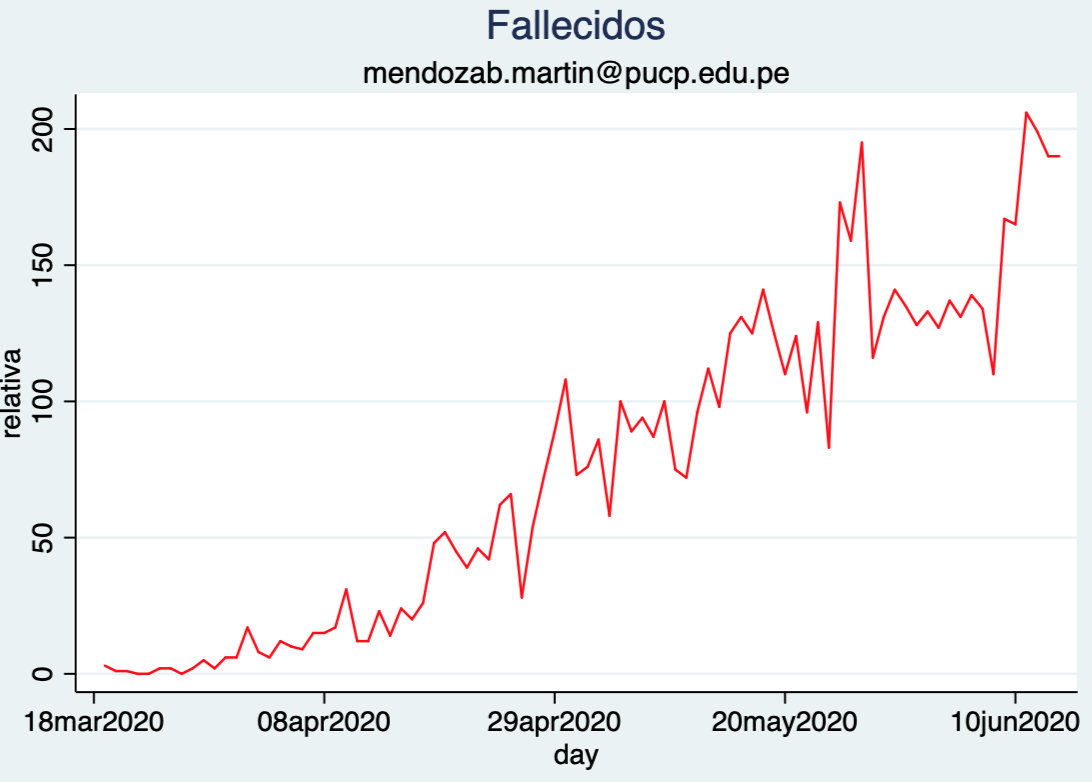
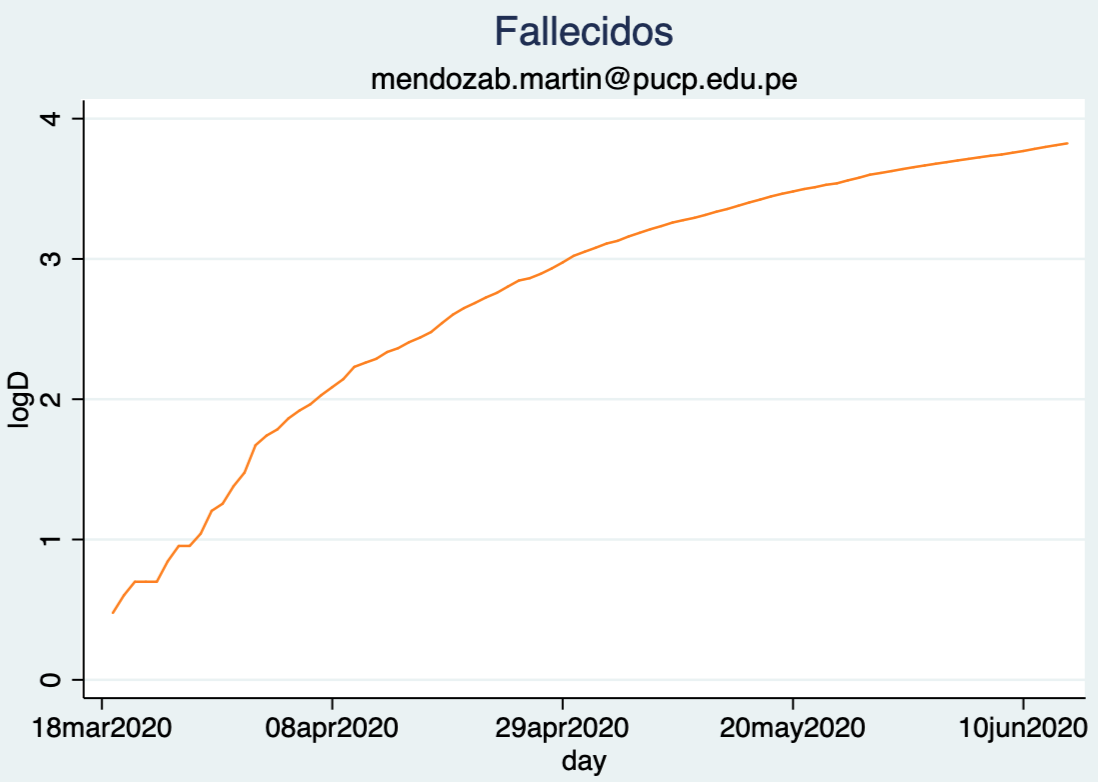
Fuente: ourworldindata.org

Fuente: ourworldindata.org

Fuente: ourworldindata.org
A continuación presentamos un conjunto de resultados obtenidos con el software libre R a partir de una data que se utilizó en el post de fecha 04/03/13:
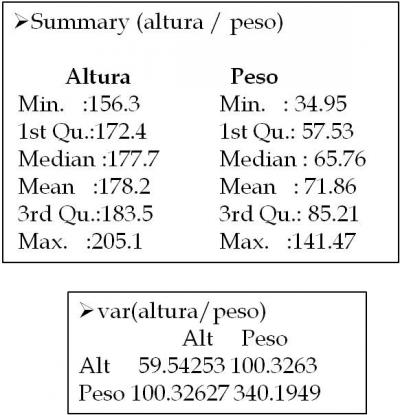
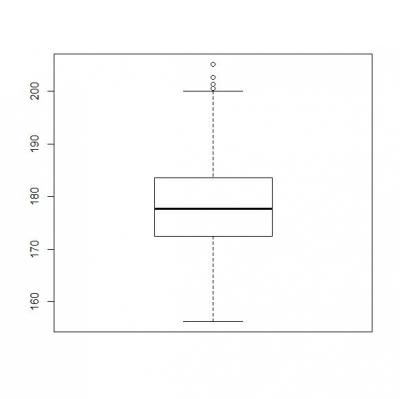
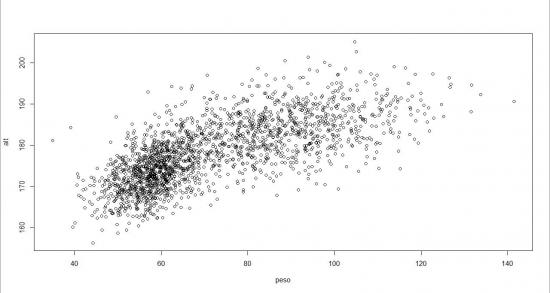
A continuación presentamos un conjunto de resultados obtenidos con el software libre R a partir de una muestra de dos mil personas según estatura (en centímetros) y peso (en kilogramos). La data ya se utilizó en un post de fecha 13/07/12:
Descriptivos:
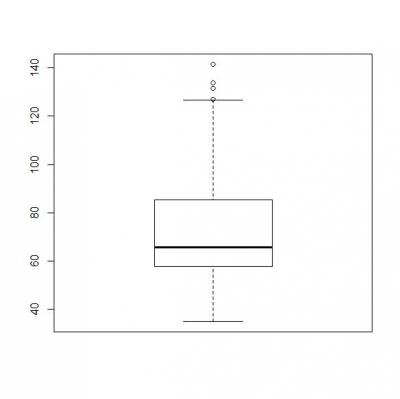
Boxplot (altura):
Boxplot (peso):
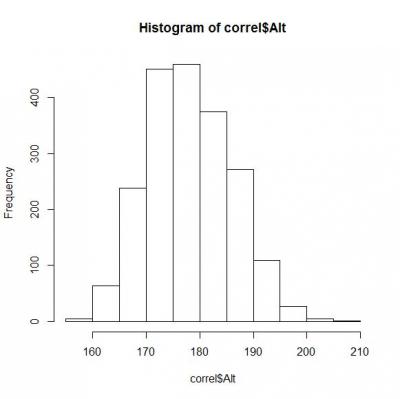
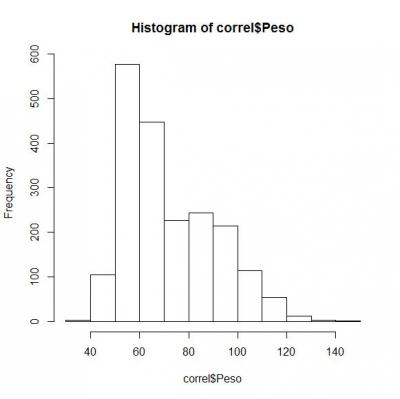
Histograma:
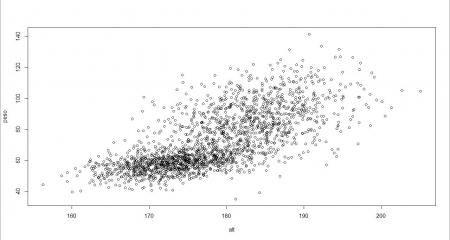
Dispersión:
Unidad de medida:
Winstats:
InfoStat:
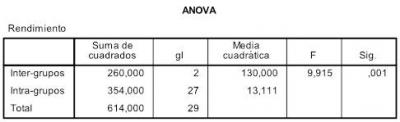
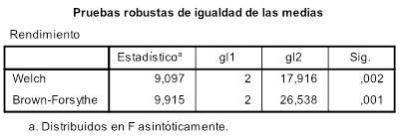
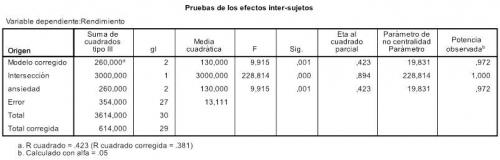
Spss:
Texto de Referencia: Análisis de datos en ciencias sociales y de la salud II
Autores: Antonio Pardo / Rafael San Martín – Editorial SINTESIS. 2010 (pág.194)
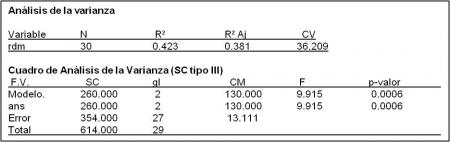
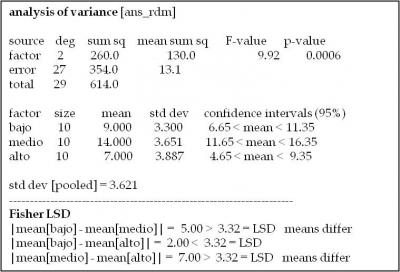
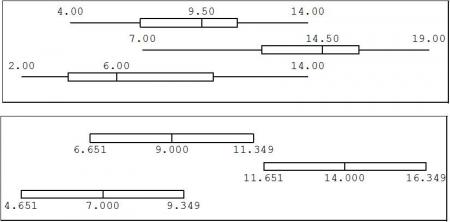
La data consta de puntuaciones en rendimiento de 30 sujetos con diferentes niveles de ansiedad.
Spss:
InfoStat:
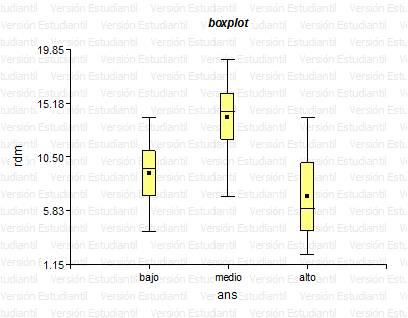
Winstats:
Texto de Referencia: Psicoestadística descriptiva
Autor: Juan Carro Ramos. Amarú Ediciones; 1994 (pág.172)
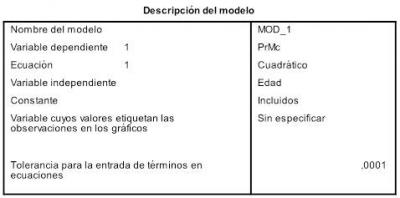
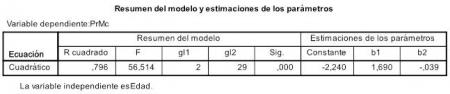
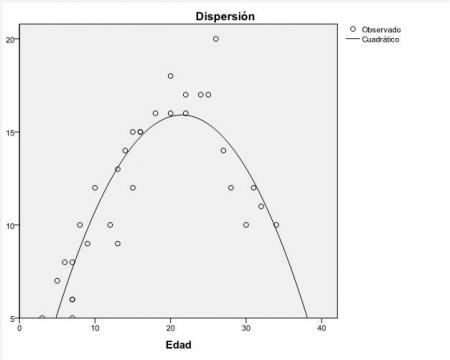
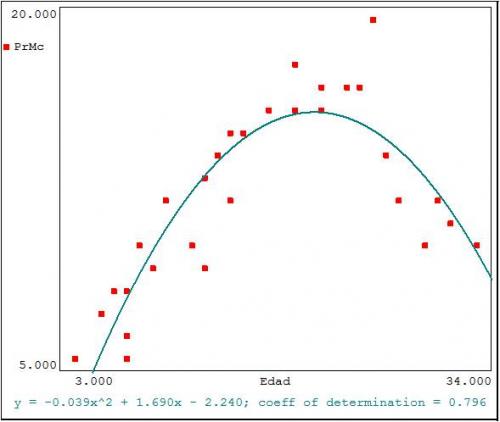
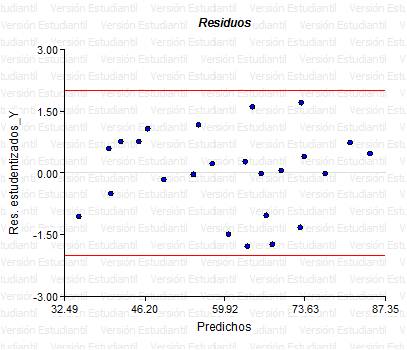
La data consta de 32 sujetos con edades (X) comprendidas entre los 3 y 34 años, en una prueba de precisión mecánica (Y).
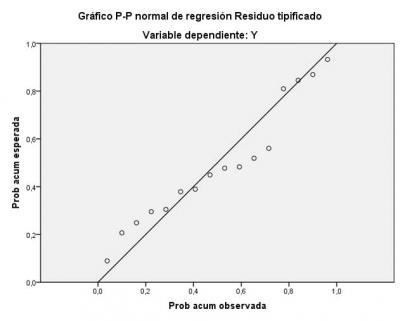
SPSS:
InfoStat:
Winstats:
Reference: Chatterjee, Sangit & Yilmaz, Mustafa. (1992). A review of regression diagnostics for behavioral research. Applied Psychological Measurement, 16, 209-227. doi:10.1177/014662169201600301
Description: abstract.
Referencia web: data (pg.218), paper (fig.4; fig.5)
Infostat:
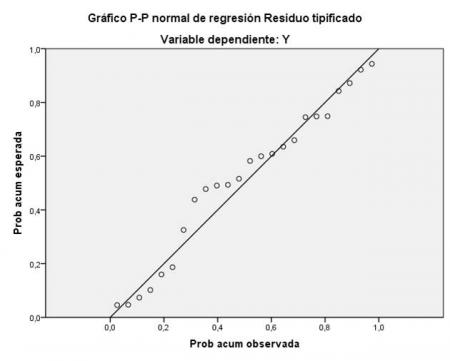
Spss:
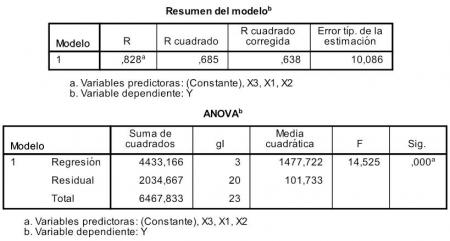
Observaciones:
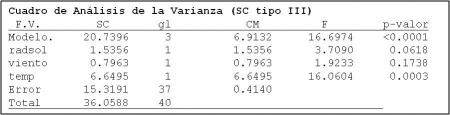
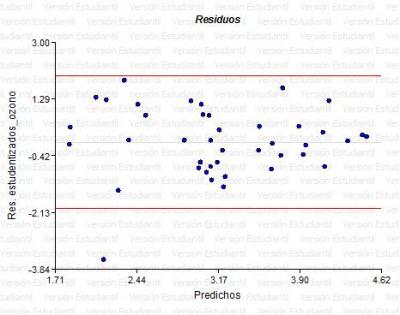
(1) En la página 218 del artículo (donde se presenta la data) se modela la ecuación de regresión (ecuación 16). Los coeficientes de regresión compilados con Infostat y Spss coinciden. Inclusive se compiló la data con el software SYSTAT (versión estudiante) y se obtuvieron los mismos coeficientes.
(2) En el paper (fig.4; fig.5) citado en la referencia web verificar las puntuaciones en el eje Y (¿nivel de ansiedad?)
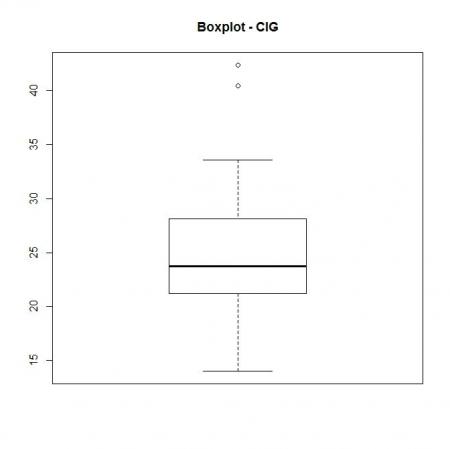
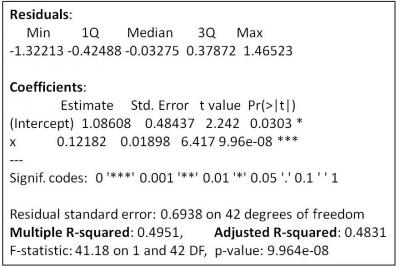
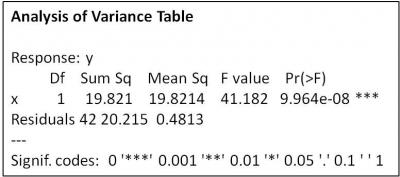
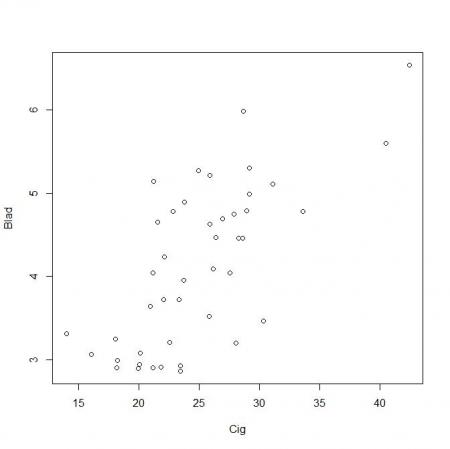
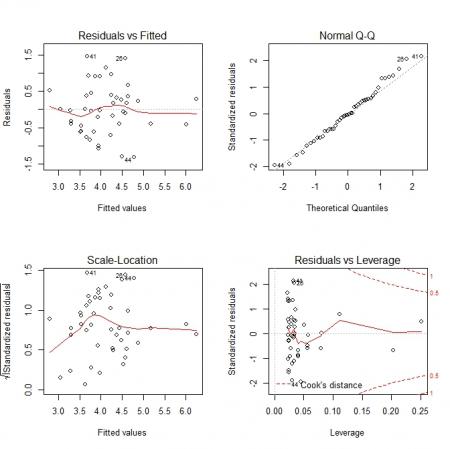
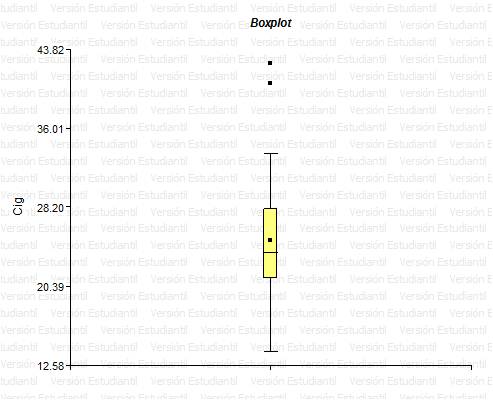
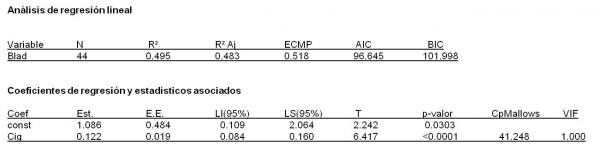
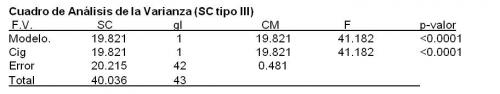
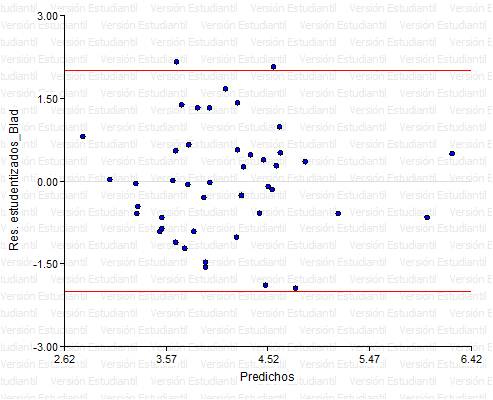
Reference: J.F. Fraumeni, “Cigarette Smoking and Cancers of the Urinary Tract: Geographic Variations in the United States,” Journal of the National Cancer Institute, 41, 1205-1211.
Authorization: free use
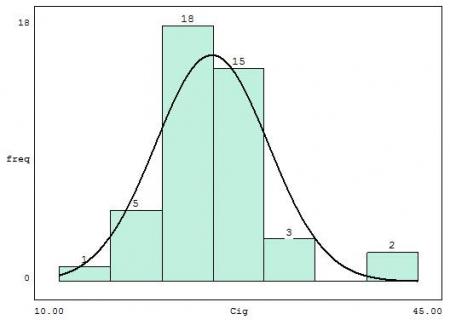
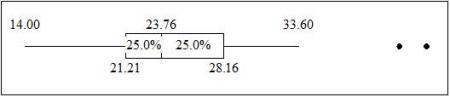
Description: The data are per capita numbers of cigarettes smoked (sold) by 43 states and the District of Columbia in 1960 together with death rates per thouusand population from various forms of cancer.
Referencia web: data, boxplot, paper.
Winstats:
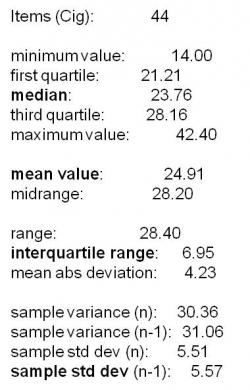
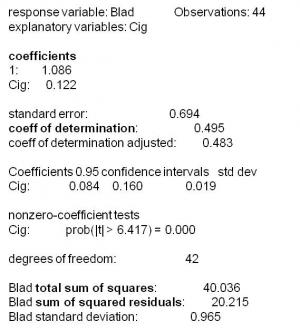
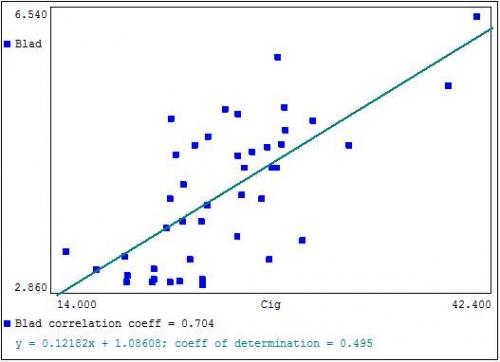
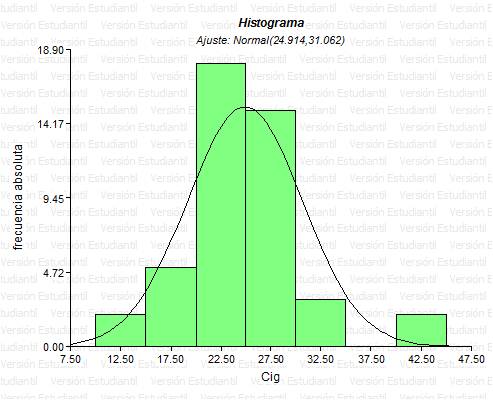
InfoStat:

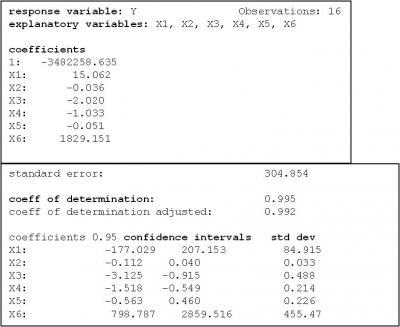
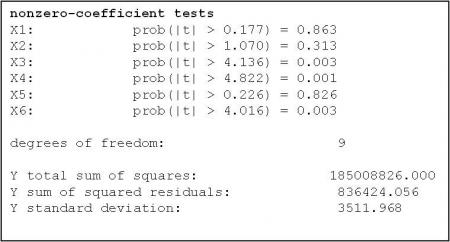
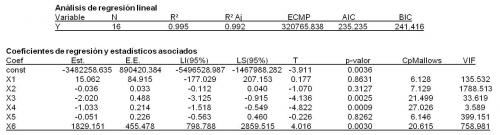
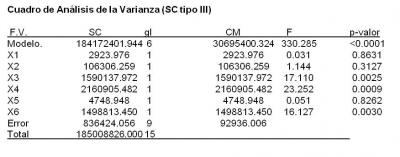
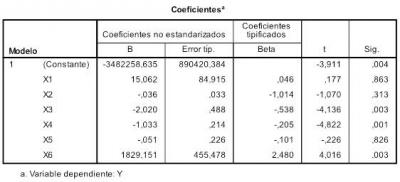
Reference: Longley, J. W. (1967). An Appraisal of Least Squares Programs for the Electronic Computer from the Viewpoint of the User. Journal of the American Statistical Association, 62, pp. 819-841
Model: y = B0 + B1*x1 + B2*x2 + B3*x3 + B4*x4 + B5*x5 + B6*x6 + e
Authorization: free use.
Referencia web: data y resultados.
InfoStat:
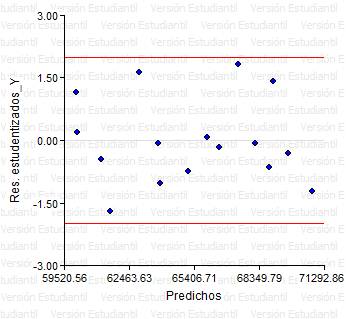
Spss:

Winstats: